
One of the most basic ways to check your health is to know how much you weigh in relation to your height. Even though a lot of people use digital tools and automated solutions these days, it’s still very useful to know how to read a BMI chart by hand. It gives you both freedom from technology and a better understanding of how body mass index works.
This detailed guide will show you everything you need to know about using a BMI chart instead of a calculator, including the basics of BMI, how to read it step by step, how to use it in real life, common mistakes, and expert advice. If you want a quicker method, you can also use our BMI calculator for instant results.
What Is BMI and Why Does It Matter?
The Body Mass Index (BMI) is a number that comes from a person’s height and weight. It is commonly employed in health and medical domains as a screening instrument to classify individuals into various weight categories, including underweight, normal weight, overweight, and obesity.
BMI doesn’t directly measure body fat, but for most people, it is a good way to tell how much fat they have. Healthcare professionals often use it as a starting point to figure out what health problems could be caused by being overweight, like heart disease, diabetes, and metabolic disorders.
You can understand BMI better if you do it by hand instead of using a calculator. This lets you check your health anywhere, anytime.
Why Use a BMI Chart Instead of a Calculator?
You might be wondering why anyone would want a BMI chart in a world full of smartphones and online tools. The answer is in control, understanding, and ease of access.
You can see what category your body mass falls into without having to type anything on a BMI chart. This can be very helpful when you can’t get to the internet or when you’re teaching students about health metrics. It also gets rid of the need for automated outputs and helps people understand body measurements in a more natural way.
Also, clinics, schools, gyms, and wellness programs often use charts because they make it easy to quickly assess a group without having to do the math for each person.
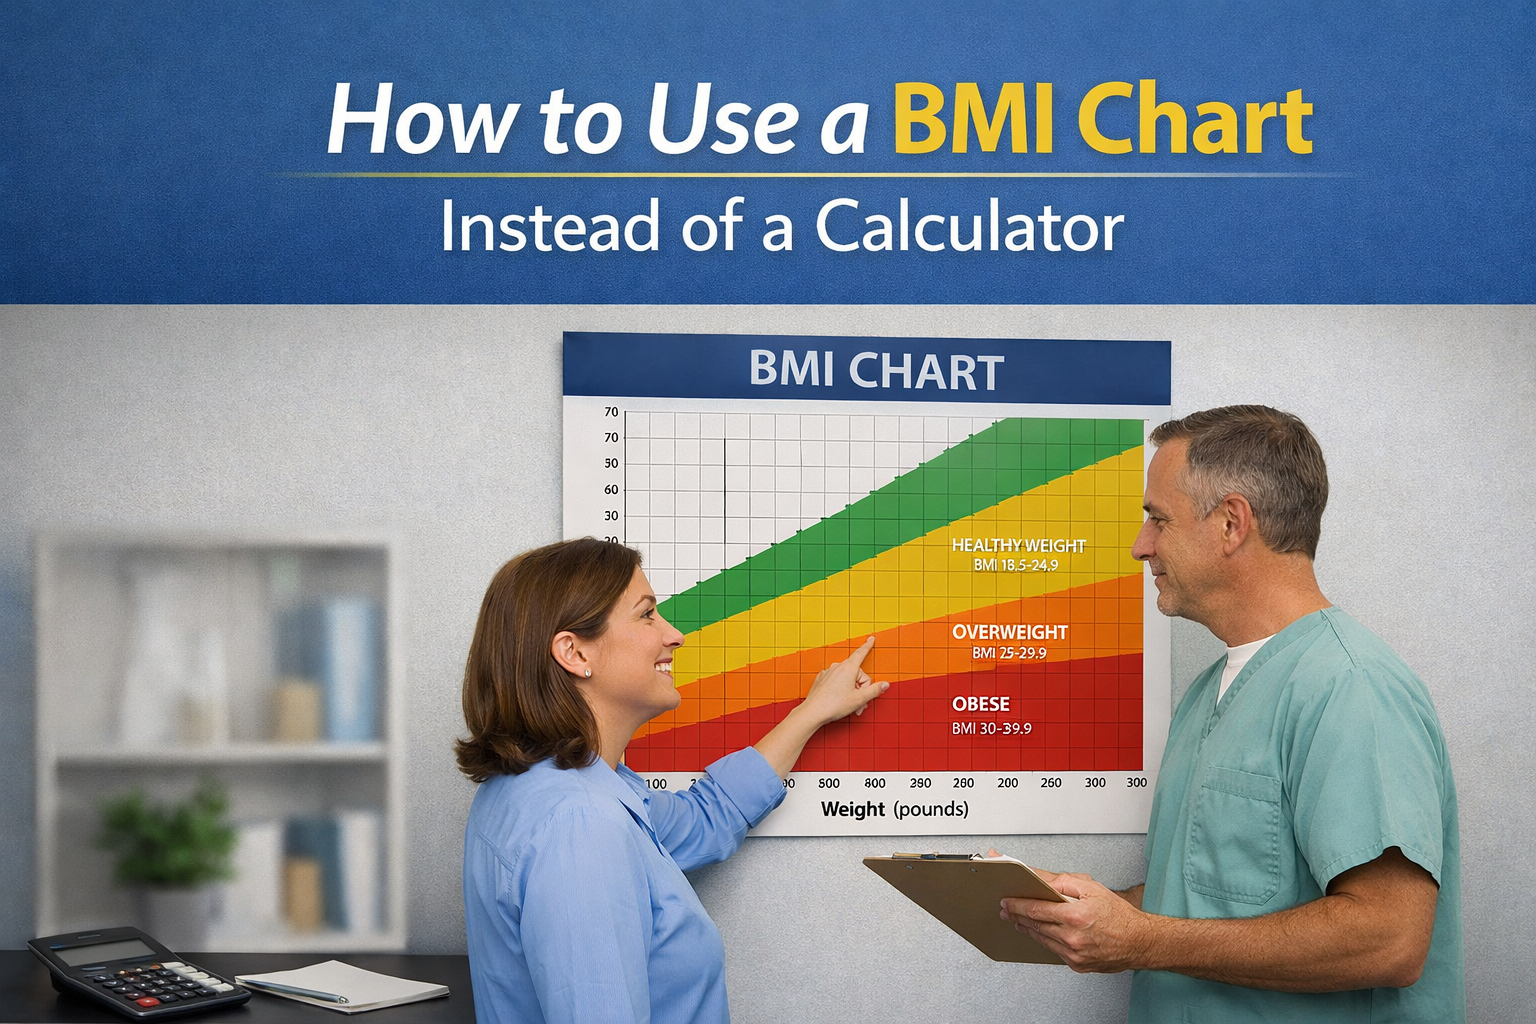
Understanding the Structure of a BMI Chart
A BMI chart is basically a grid that shows how height and weight are related. The height measurements are on one axis (usually vertical), and the weight values are on the other axis (usually horizontal). The points where these two dimensions meet are BMI values or categories.
The chart is usually split into shaded areas that show different BMI groups:
- Underweight
- Normal weight
- Overweight
- Obese
You can easily tell what category you’re in by finding the intersection of your height and weight. Each region is clearly marked.
How to Use a BMI Chart in Steps
Step 1: Measure Your Height Accurately
The first step is to measure how tall you are. You should use the same units for all of the charts, either centimeters or inches. For the most accurate reading, stand straight against a wall without shoes on.
Step 2: Measure Your Weight
Next, weigh yourself on a scale that you can trust. Make sure the chart’s units (kilograms or pounds) are the same again. For the most accurate results, weigh yourself under the same conditions every time.
Step 3: Locate Your Height on the Chart
On the vertical axis of the BMI chart, look for your height. It’s easy to find your measurement on a chart because they are usually arranged in ascending order.
Step 4: Locate Your Weight on the Chart
Now look for your weight on the horizontal line. This step is easy, but accuracy is important. If you need to, round to the nearest value.
Step 5: Identify the Intersection Point
Draw a line horizontally from your height and a line vertically from your weight. The point where these lines cross shows what your BMI category is.
Step 6: Interpret the Result
Check the color or label of the area where your intersection is. This will show you if you are underweight, at a normal weight, overweight, or obese.
BMI Categories Explained in Detail
1. Underweight
You are underweight if your BMI is less than 18.5. This could mean that you aren’t getting enough nutrients, that you have a health problem, or that your metabolism is too fast. It’s important to look at your eating habits and see a professional if you need to.
2. Normal Weight
A BMI of 18.5 to 24.9 is a good range for health. This range is linked to a lower risk of chronic diseases and is a good sign of a healthy lifestyle in general.
3. Overweight
If your BMI is between 25 and 29.9, you are overweight. It may not be dangerous right away, but it could make health problems more likely in the long run.
4. Obesity
If your BMI is 30 or higher, you are considered obese. This is linked to a greater risk of serious health problems and often calls for medical advice and changes to how you live.
Advantages of Using a BMI Chart
There are more benefits to using a BMI chart than just doing math.
It helps you understand how height and weight affect each other. You don’t just get a single number from a calculator; you see the whole picture. This can be very helpful for keeping track of changes over time because you can see how things move between categories.
Charts are also very useful in schools and hospitals. They are great for workshops, classrooms, and remote areas because they let you quickly assess without needing any devices.
Another good thing about charts is that they help people become more aware. When people can see their position, it often has a bigger effect than just giving them a number.
Limitations of BMI Charts
BMI charts are helpful, but they aren’t perfect.
They don’t take into account muscle mass, bone density, or where fat is stored. For instance, athletes who are physically fit but have a lot of muscle mass may still be considered overweight.
BMI also doesn’t tell the difference between different kinds of fat. BMI treats visceral fat (around organs) and subcutaneous fat the same, but visceral fat is more dangerous.
So, BMI charts are useful, but they should be used with other health indicators like waist size, diet, and how much exercise you get.
Practical Tips for Accurate Use
To get the most out of a BMI chart, you need to be consistent. Always use the same measurements and conditions when you measure. Don’t guess your measurements, because even small mistakes can change your category.
A chart that is high-quality and easy to read is also useful. Some charts show exact BMI values at each intersection, while others use color-coded zones.
If you use the chart often, you might want to print it out or save a digital copy so you can look at it quickly.
When a BMI Calculator Might Be Better
BMI charts work very well, but there are times when a calculator might be easier to use.
For instance, a calculator can give you a more exact BMI number than a category. Having access to digital tools also makes it easier to use on your own.
This is where platforms like Wideversa come in. Wideversa has the best online BMI calculator that lets people quickly and easily find out their BMI. Charts are great for learning and seeing things, but calculators are better when you need speed and accuracy.
Integrating BMI Awareness Into Daily Life
BMI isn’t just a way to group people; it’s also about being aware and taking action.
You become more aware of how your weight changes over time when you check your BMI on a chart on a regular basis. Being aware of this can help you make healthier choices, like eating a balanced diet and working out regularly.
It also helps you set goals that are possible to reach. You can work toward moving into a healthier BMI category over time instead of just focusing on your weight.
Common Mistakes to Avoid
A lot of people make mistakes when they use BMI charts.
Using the wrong units is a common mistake. Make sure that the way the chart measures your height and weight is always correct.
Another mistake is reading the intersection point wrong. Take your time to get both axes right.
Some people only look at their BMI and don’t think about other health factors. Keep in mind that BMI is not a way to find out what is wrong with you.
The Role of BMI in Modern Health Awareness
BMI is still one of the most popular health indicators in the world, even though it has some flaws. Because it is easy to use and find, it is a useful tool for both people and healthcare providers.
Using a BMI chart makes this even easier and helps people learn more about their own health metrics. It fills in the gap between raw data and useful interpretation.
Why Wideversa Is a Smart Complement
It’s helpful to learn how to use a BMI chart, but using it with modern tools can make it even better.
Wideversa.com has a free, very accurate online BMI calculator that works well with manual methods. Their tool is a great resource if you need quick results or exact numbers.
Using both a chart and a calculator gives you the best of both worlds: you can see what you’re doing and do it right.
FAQs About Using a BMI Chart
1. Is it okay to use a BMI chart for kids?
BMI charts for kids are different for each age group. Always use pediatric charts that are made for growth patterns.
2. Is a BMI chart right?
It works well for general screening, but it doesn’t take into account muscle mass or fat distribution.
3. What kind of units should I use?
Always use the same units for your measurements as the chart shows, either metric or imperial.
4. How often do I need to check my BMI?
For keeping an eye on trends, checking once a month is usually enough.
5. Can athletes trust BMI charts?
Athletes should be careful when using BMI because muscle mass can change the results.
6. What if my BMI is close to the limit?
Instead of looking at just one category, look at all of them.
7. Are all BMI charts the same?
Most of them fit into standard groups, but the design and labels may be different.
8. Are BMI charts a good substitute for medical advice?
No, they are just a way to check for problems and not a replacement for professional help.
9. Are BMI charts useful for people of all ages?
They are most accurate for adults. Kids and older people need special charts.
10. Is a chart better than a calculator?
Each one has its own strengths. Charts help you see things, and calculators help you get things right.
Conclusion
Using a BMI chart instead of a calculator is a good way to get a better idea of how your weight compares to your height. It promotes autonomy, improves understanding, and offers a visual perspective that calculators cannot duplicate.
But using both old and new tools together can give you a more complete picture. Wideversa.com and other sites like it make it easy to find a free, reliable BMI calculator whenever you need to know your exact results.
Summary
A BMI chart is a simple but useful tool that lets you find out what weight category you are in by putting your height and weight on a grid. It makes things easier to understand by getting rid of the need for calculations. It has some flaws, but it is still a good way to check on your overall health. You can use tools like the free BMI calculator on Wideversa.com with charts to get a more accurate and easy way to keep track of your health.